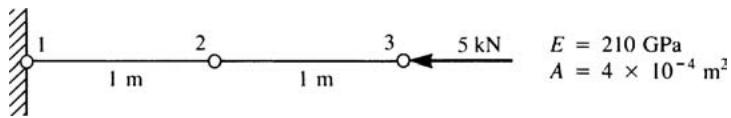
text_image
1
1 m
2
1 m
3
5 kN
E = 210 GPa
A = 4 × 10⁻⁴ m²
Figure P3–2
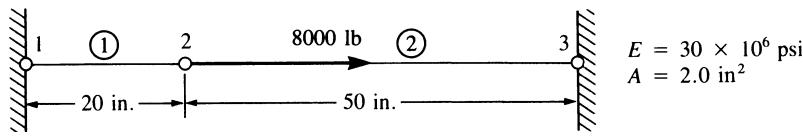
text_image
1 ① 2 8000 lb ② 3
20 in. 50 in. E = 30 × 10⁶ psi
A = 2.0 in²
Figure P3–3
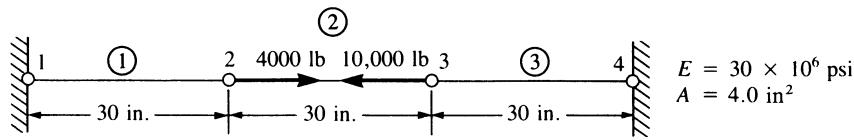
text_image
1
①
2
4000 lb
10,000 lb
3
②
③
4
30 in.
30 in.
30 in.
E = 30 × 10⁶ psi
A = 4.0 in²
Figure P3–4
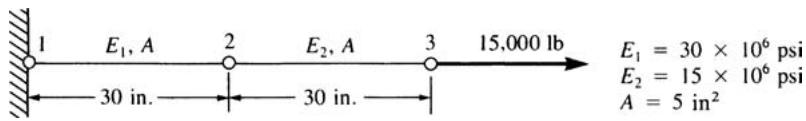
text_image
1 E₁, A 2 E₂, A 3 15,000 lb
30 in. 30 in. E₁ = 30 × 10⁶ psi
E₂ = 15 × 10⁶ psi
A = 5 in²
Figure P3–5
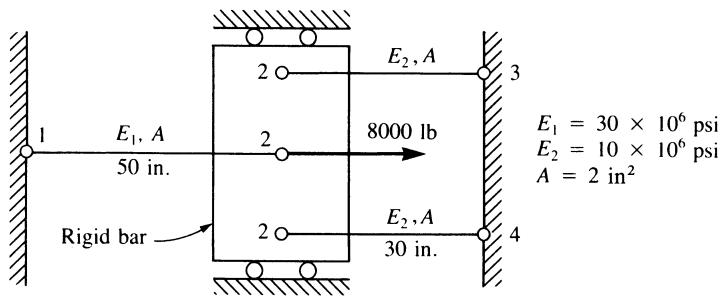
text_image
E1, A
50 in.
Rigid bar
2
E2, A
8000 lb
3
E1 = 30 × 10^6 psi
E2 = 10 × 10^6 psi
A = 2 in^2
2
E2, A
30 in.
Figure P3–6
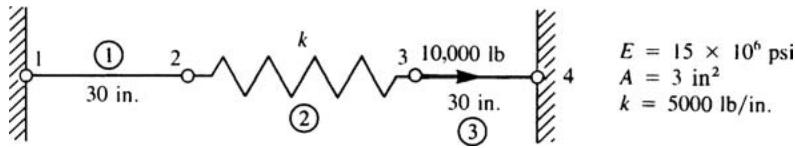
text_image
1
①
30 in.
2
k
3 10,000 lb
30 in.
②
③
4
E = 15 × 10^6 psi
A = 3 in^2
k = 5000 lb/in.
Figure P3–7
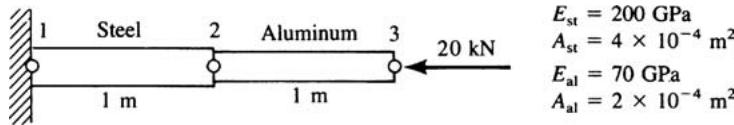
text_image
1 Steel 2 Aluminum 3
1 m 1 m
20 kN
E_st = 200 GPa
A_st = 4 × 10^-4 m^2
E_al = 70 GPa
A_al = 2 × 10^-4 m^2
Figure P3–8
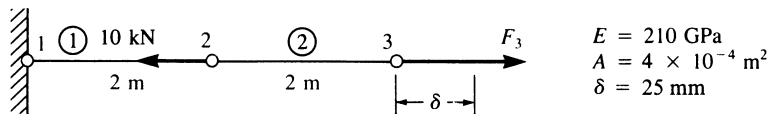
text_image
1 ① 10 kN 2 ② 3 F₃
2 m 2 m δ δ
E = 210 GPa
A = 4 × 10⁻⁴ m²
δ = 25 mm
Figure P3–9
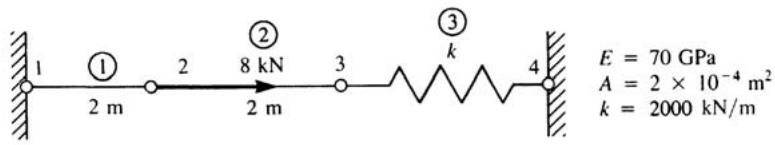
text_image
1
①
2 m
2
8 kN
2 m
3
②
k
③
4
E = 70 GPa
A = 2 × 10⁻⁴ m²
k = 2000 kN/m
Figure P3–10
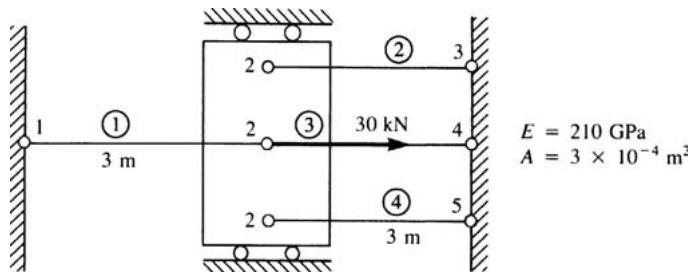
text_image
1
①
3 m
2
②
3
2
③
30 kN
4
2
④
3 m
5
E = 210 GPa
A = 3 × 10⁻⁴ m²
Figure P3–11
3.12 Solve for the axial displacement and stress in the tapered bar shown in Figure P3–12 using one and then two constant-area elements. Evaluate the area at the center of each element length. Use that area for each element. Let $A _ { 0 } = 2 \mathrm { i n } ^ { 2 } , L = 2 0$ in., $E = 1 0 \times 1 0 ^ { 6 }$ psi, and $P = 1 0 0 0$ lb. Compare your finite element solutions with the exact solution.
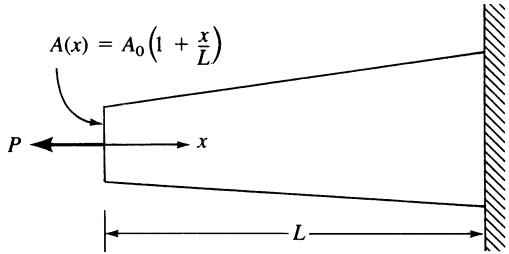
text_image
A(x) = A₀(1 + x/L)
P ← x
L
Figure P3–12
3.13 Determine the stiffness matrix for the bar element with end nodes and midlength node shown in Figure P3–13. Let axial displacement $u = a _ { 1 } + a _ { 2 } x + a _ { 3 } x ^ { 2 }$ . (This is a higherorder element in that strain now varies linearly through the element.)
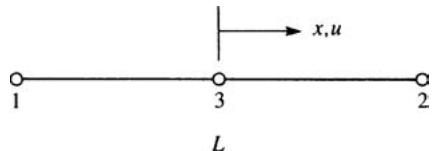
text_image
x,u
1 3 2
L
Figure P3–13
3.14 Consider the following displacement function for the two-noded bar element:
$$
u = a + b x ^ {2}
$$
Is this a valid displacement function? Discuss why or why not.
3.15 For each of the bar elements shown in Figure P3–15, evaluate the global x-y stiffness matrix.
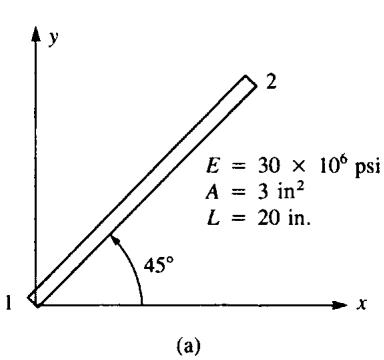
text_image
y
2
E = 30 × 10⁶ psi
A = 3 in²
L = 20 in.
45°
1
x
(a)
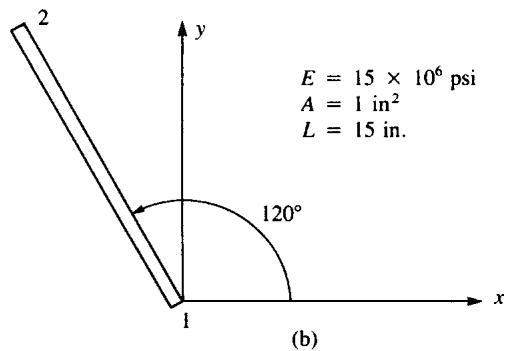
text_image
2
y
E = 15 × 10⁶ psi
A = 1 in²
L = 15 in.
120°
x
(b)
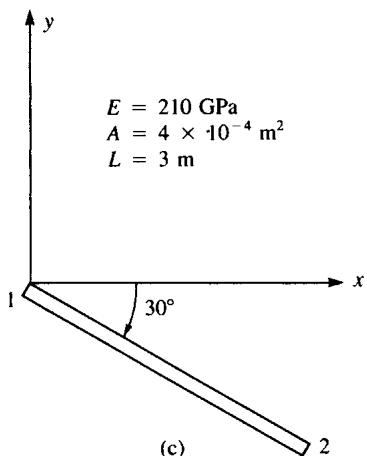
text_image
E = 210 GPa
A = 4 × 10⁻⁴ m²
L = 3 m
1
30°
2
(c)
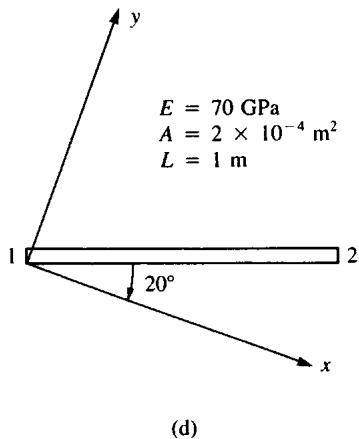
text_image
E = 70 GPa
A = 2 × 10⁻⁴ m²
L = 1 m
1
2
20°
x
y
(d)
Figure P3–15
3.16 For the bar elements shown in Figure P3–16, the global displacements have been determined to be $d _ { 1 x } = 0 . 5$ in., $d _ { 1 y } = 0 . 0 , d _ { 2 x } = 0 . 2 5$ in., and $d _ { 2 y } = 0 . 7 5$ in. Determine the local x^ displacements at each end of the bars. Let $E = 1 2 \times 1 0 ^ { 6 } \ \mathrm { p s i } , A = 0 . 5 \ \mathrm { i n } ^ { 2 }$ , and $L = 6 0$ in. for each element.
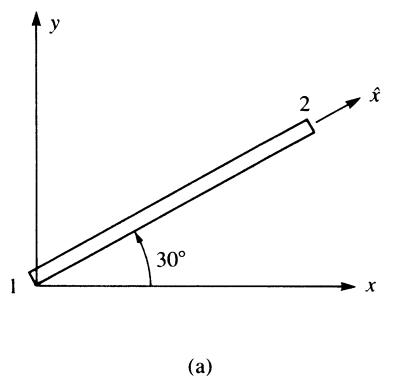
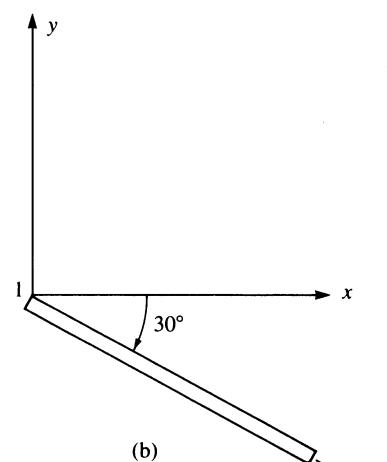
text_image
y
2
x̂
30°
1
x
(a)
text_image
y
1
30°
x
(b)
2
x̂
Figure P3–16
3.17 For the bar elements shown in Figure P3–17, the global displacements have been determined to be $d _ { 1 x } = 0 . 0 , d _ { 1 y } = 2 . 5$ mm, $d _ { 2 x } = 5 . 0$ mm, and $d _ { 2 y } = 3 . 0$ mm. Determine the local x^ displacements at the ends of each bar. Let E ¼ 210 GPa, $A = 1 0 \times 1 0 ^ { - 4 }$ $\mathbf { m } ^ { 2 } .$ , and $L = 3$ m for each element.
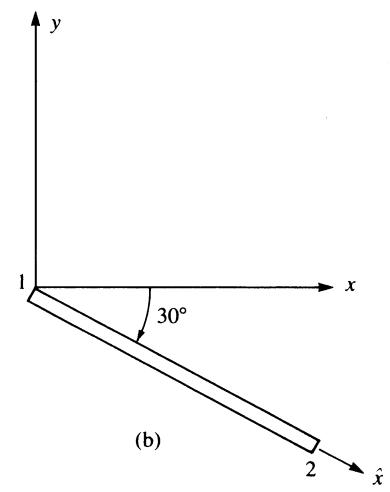
text_image
x̂
2
y
120°
x
(a)
text_image
y
1
30°
x
(b)
Figure P3–17
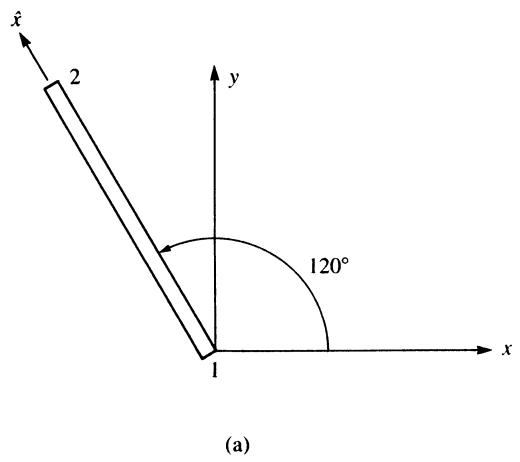
3.18 Using the method of Section 3.5, determine the axial stress in each of the bar elements shown in Figure P3–18.
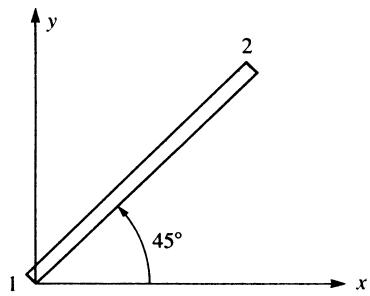
text_image
y
2
45°
1
x
(a)
$$
E = 3 0 \times 1 0 ^ {6} \mathrm{psi}
$$
$$
A = 2 \mathrm{in} ^ {2}
$$
$$
L = 6 0 \text { in. }
$$
$$
d _ {1 x} = 0 \quad d _ {1 y} = 0
$$
$$
d _ {2 x} = 0. 0 1 \text { in. } d _ {2 y} = 0. 0 2 \text { in. }
$$
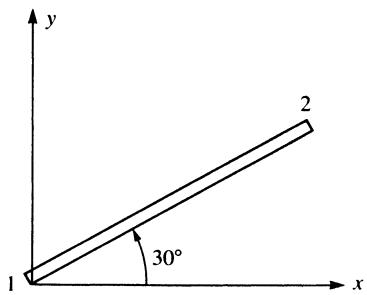
text_image
y
2
1
30°
x
(b)
$$
E = 2 1 0 \mathrm{GPa}
$$
$$
A = 3 \times 1 0 ^ {- 4} \mathrm{m} ^ {2}
$$
$$
L = 3 \mathrm{m}
$$
$$
d _ {1 x} = 0. 2 5 \mathrm{mm} \quad d _ {1 y} = 0. 0
$$
$$
d _ {2 x} = 1. 0 0 \mathrm{mm} \quad d _ {2 y} = 0. 0
$$
Figure P3–18
3.19 a. Assemble the stiffness matrix for the assemblage shown in Figure P3–19 by superimposing the stiffness matrices of the springs. Here k is the stiffness of each spring.
b. Find the x and y components of deflection of node 1.
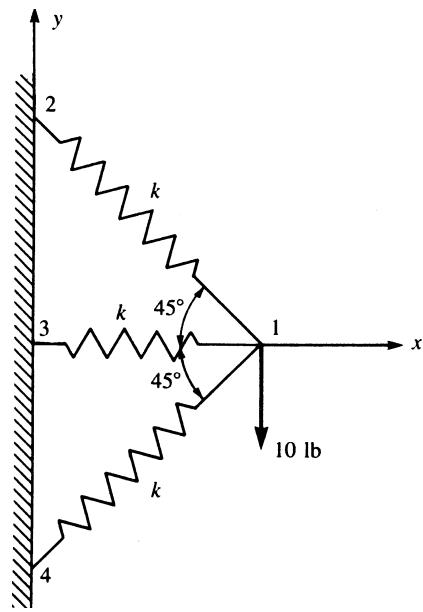
text_image
y
2
k
3
k
45°
45°
1
x
k
4
10 lb
Figure P3–19
3.20 For the plane truss structure shown in Figure P3–20, determine the displacement of node 2 using the stiffness method. Also determine the stress in element 1. Let $A = 5$ $\mathrm { i n } ^ { 2 } , E = 1 \times 1 0 ^ { 6 }$ psi, and $L = 1 0 0$ in.
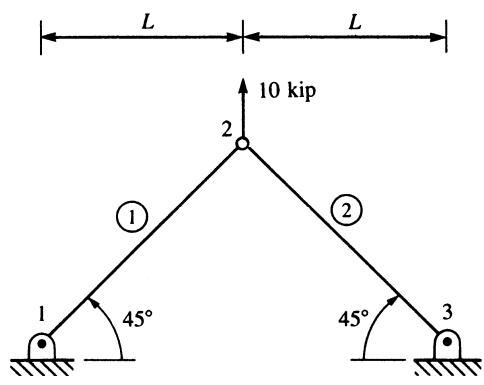
text_image
L
L
10 kip
2
①
②
1
45°
45°
3
Figure P3–20
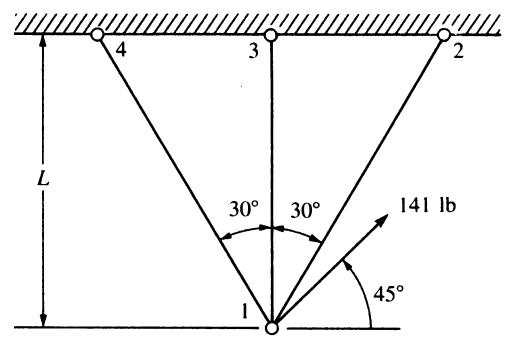
text_image
L
4
3
2
30°
30°
141 lb
45°
1
Figure P3–21
3.21 Find the horizontal and vertical displacements of node 1 for the truss shown in Figure P3–21. Assume AE is the same for each element.
3.22 For the truss shown in Figure P3–22 solve for the horizontal and vertical components of displacement at node 1 and determine the stress in each element. Also verify force equilibrium at node 1. All elements have $A _ { 1 } = 1 ~ \mathrm { i n } . ^ { 2 }$ and $E = 1 0 \times 1 0 ^ { 6 }$ psi. Let $L =$ 100 in.
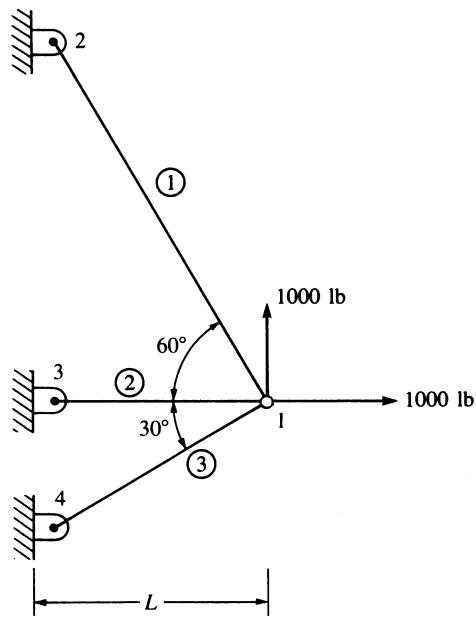
text_image
2
①
1000 lb
60°
30°
1
1000 lb
②
3
③
4
L
Figure P3–22
3.23 For the truss shown in Figure P3–23, solve for the horizontal and vertical components of displacement at node 1. Also determine the stress in element 1. Let $A = 1 \ \mathrm { i n } ^ { 2 }$ , $E = \bar { 1 0 } . 0 \times 1 0 ^ { 6 }$ psi, and L ¼ 100 in.
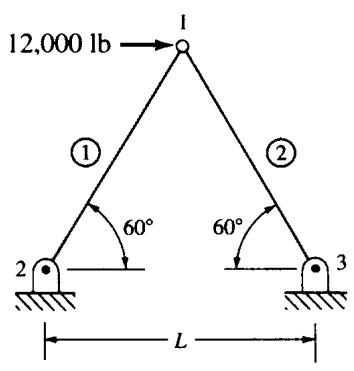
text_image
12,000 lb
①
②
60°
60°
②
③
L
Figure P3–23
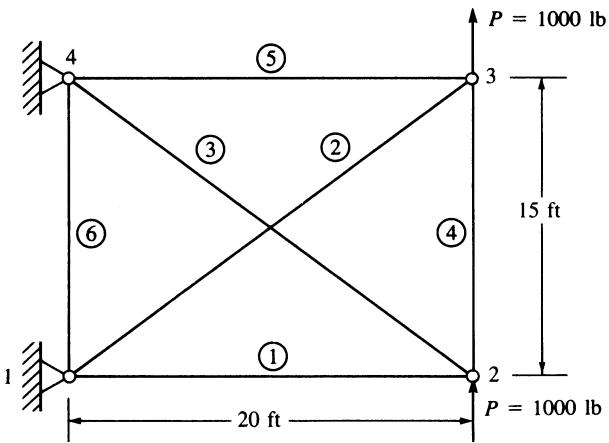
text_image
P = 1000 lb
15 ft
20 ft
P = 1000 lb
Figure P3–24
3.24 Determine the nodal displacements and the element forces for the truss shown in Figure P3–24. Assume all elements have the same AE.
3.25 Now remove the element connecting nodes 2 and 4 in Figure P3–24. Then determine the nodal displacements and element forces.
3.26 Now remove both cross elements in Figure P3–24. Can you determine the nodal displacements? If not, why?
3.27 Determine the displacement components at node 3 and the element forces for the plane truss shown in Figure P3–27. Let $A = 3 ~ \mathrm { i n } ^ { 2 }$ and $E = 3 0 \times 1 0 ^ { 6 }$ psi for all elements. Verify force equilibrium at node 3.
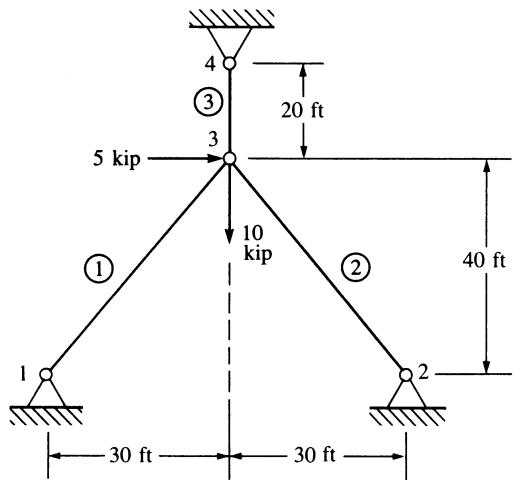
text_image
4
③
20 ft
5 kip
3
10 kip
①
②
40 ft
1
2
30 ft
30 ft
Figure P3–27
3.28 Show that for the transformation matrix $\underline { T }$ of Eq. (3.4.15), $\underline { T } ^ { T } = \underline { T } ^ { - 1 }$ and hence Eq. (3.4.21) is indeed correct, thus also illustrating that ${ \underline { { k } } } = { \underline { { T } } } ^ { T } { \underline { { \hat { k } } } } { \underline { { T } } }$ is the expression for the global stiffness matrix for an element.
3.29–3.30 For the plane trusses shown in Figures P3–29 and P3–30, determine the horizontal and vertical displacements of node 1 and the stresses in each element. All elements have E ¼ 210 GPa and $A = 4 . 0 \times 1 0 ^ { - 4 } ~ \mathrm { m } ^ { 2 }$ .
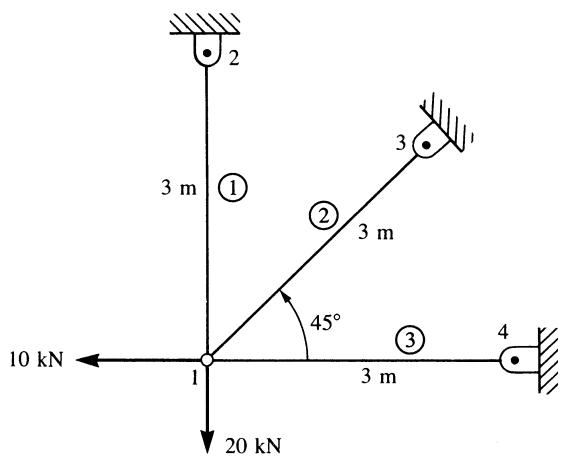
text_image
2
3 m
①
②
3 m
45°
③
10 kN
1
3 m
4
20 kN
Figure P3–29
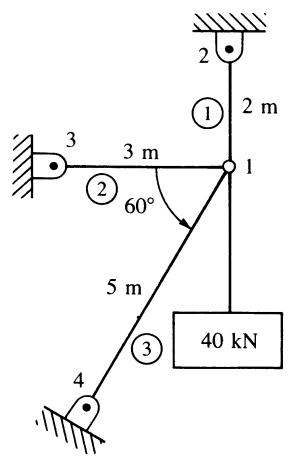
text_image
2
1
2 m
3
3 m
1
2
60°
5 m
3
4
40 kN
Figure P3–30
3.31 Remove element 1 from Figure P3–30 and solve the problem. Compare the displacements and stresses to the results for Problem 3.30.
3.32 For the plane truss shown in Figure P3–32, determine the nodal displacements, the element forces and stresses, and the support reactions. All elements have E ¼ 70 GPa and $A = 3 . 0 \times 1 0 ^ { - 4 } ~ \mathrm { m } ^ { 2 }$ . Verify force equilibrium at nodes 2 and 4. Use symmetry in your model.
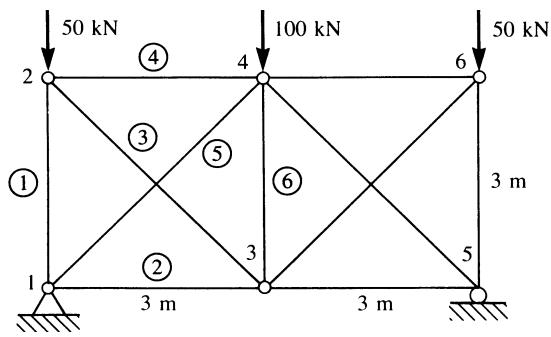
text_image
50 kN
100 kN
50 kN
2
4
6
3 m
①
③
⑤
⑥
②
3 m
3 m
1
5
1
Figure P3–32
3.33 For the plane trusses supported by the spring at node 1 in Figure P3–33 (a) and (b), determine the nodal displacements and the stresses in each element. Let $E = 2 1 0 \mathrm { G P a }$ and $A = 5 . 0 \times 1 0 ^ { - 4 } \mathrm { m } ^ { 2 }$ for both truss elements.
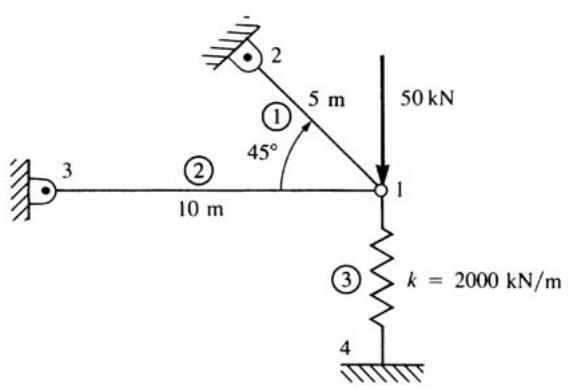
text_image
50 kN
5 m
1
45°
10 m
①
②
③
k = 2000 kN/m
4
Figure P3–33(a)
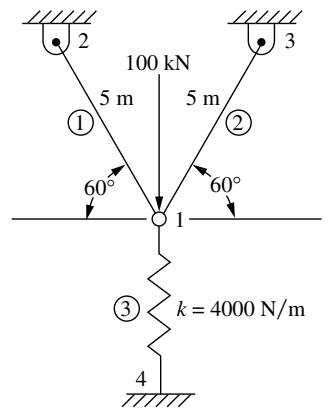
text_image
100 kN
5 m
5 m
①
②
60°
60°
③
k = 4000 N/m
4
Figure P3–33(b)
text_image
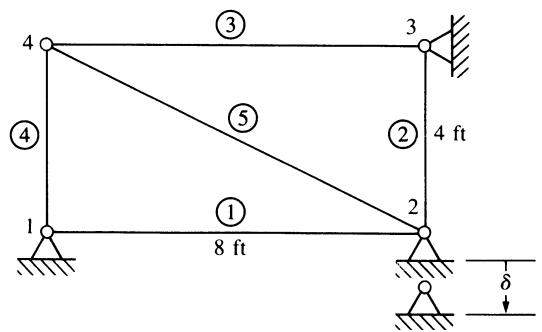
4
③
3
④
⑤
②
4 ft
①
2
1
8 ft
δ
Figure P3–34
3.34 For the plane truss shown in Figure P3–34, node 2 settles an amount $\delta = 0 . 0 5$ in. Determine the forces and stresses in each element due to this settlement. Let $E =$ $3 0 \times 1 0 ^ { 6 }$ psi and $A = 2 \mathrm { i n } ^ { 2 }$ for each element.
3.35 For the symmetric plane truss shown in Figure P3–35, determine (a) the deflection of node 1 and (b) the stress in element 1. $A E / L$ for element 3 is twice $A E / L$ for the other
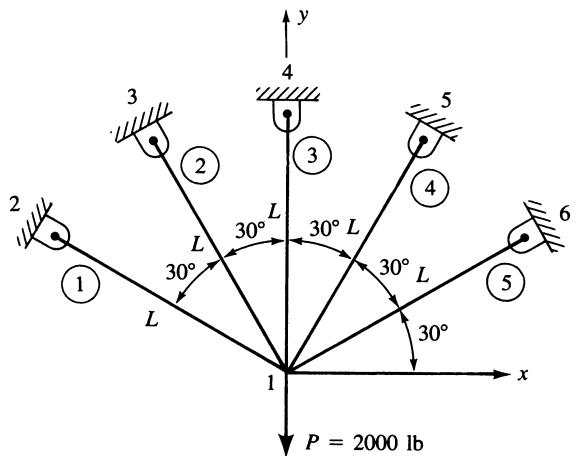
text_image
y
4
3
2
3
5
2
L
30°
L
30°
L
30°
L
30°
L
6
1
L
30°
x
P = 2000 lb
Figure P3–35
elements. Let $A E / L = 1 0 ^ { 6 } 1 \mathrm { b / i n }$ . Then let $A = 1 \mathrm { i n } ^ { 2 } , L = 1 0$ in., and $E = 1 0 \times 1 0 ^ { 6 }$ psi to obtain numerical results.
3.36–3.37 For the space truss elements shown in Figures P3–36 and P3–37, the global displacements at node 1 have been determined to be $d _ { 1 x } = 0 . 1$ in., $d _ { 1 y } = 0 . 2 \ \mathrm { i n } .$ ., and $d _ { 1 z } =$ 0:15 in. Determine the displacement along the local x^ axis at node 1 of the elements. The coordinates, in inches, are shown in the figures.
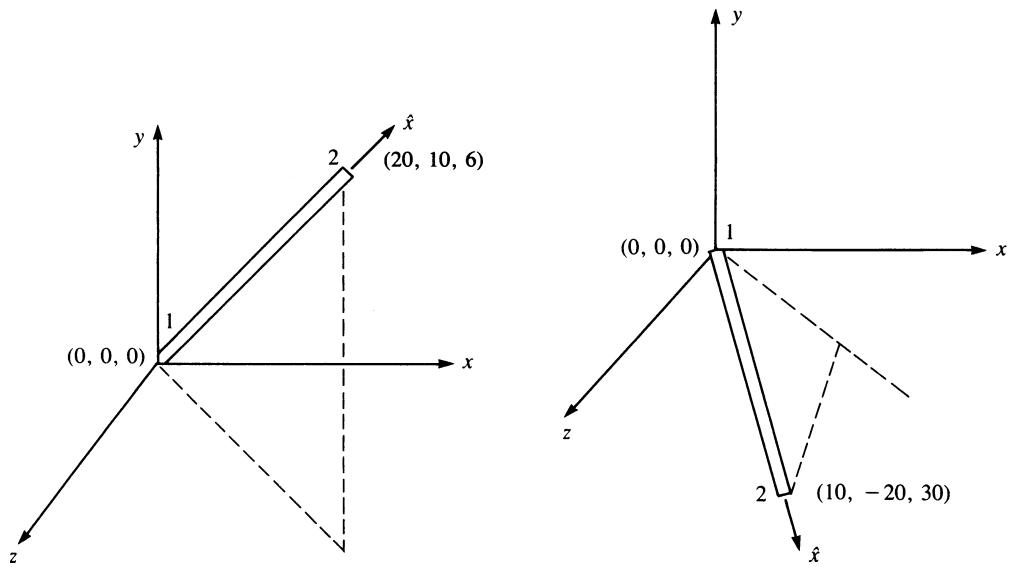
Figure P3–36
Figure P3–37
3.38–3.39 For the space truss elements shown in Figures P3–38 and P3–39, the global displacements at node 2 have been determined to be $d _ { 2 x } = 5$ mm, $d _ { 2 y } = 1 0$ mm, and
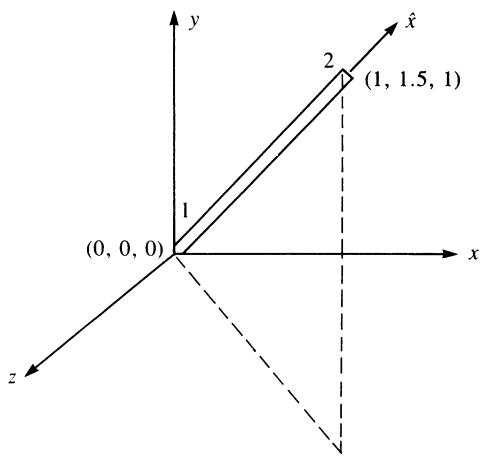
text_image
y
x
z
1
2
(1, 1.5, 1)
(0, 0, 0)
x̂
Figure P3–38
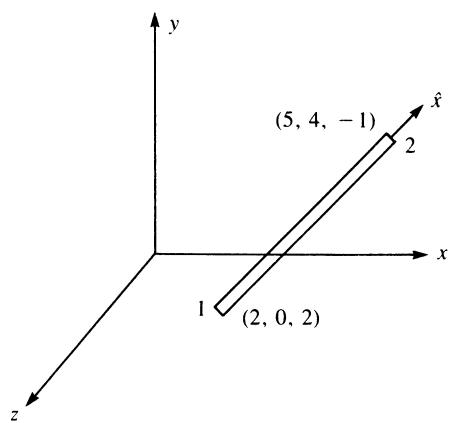
text_image
y
(5, 4, -1)
2
x
1
(2, 0, 2)
z
Figure P3–39